Pos:
Home KnowledgeTechnologyRoom-temperature photochromism of silicon vacancy centers in CVD diamondAbstract
The silicon vacancy (SiV) center in diamond is typically found in three stable charge states, SiV0, SiV–, and SiV2–, but studying the processes leading to their formation is challenging, especially at room temperature, due to their starkly different photoluminescence rates. Here, we use confocal fluorescence microscopy to activate and probe charge interconversion between all three charge states under ambient conditions. In particular, we witness the formation of SiV0 via the two-step capture of diffusing, photogenerated holes, a process we expose both through direct SiV0 fluorescence measurements at low temperatures and confocal microscopy observations in the presence of externally applied electric fields. In addition, we show that continuous red illumination induces the converse process, first transforming SiV0 into SiV– and then into SiV2–. Our results shed light on the charge dynamics of SiV and promise opportunities for nanoscale sensing and quantum information processing.
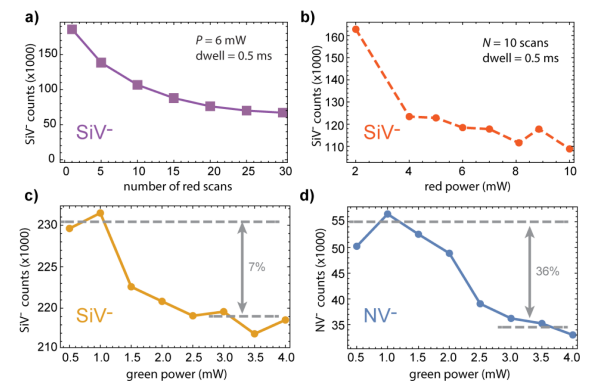
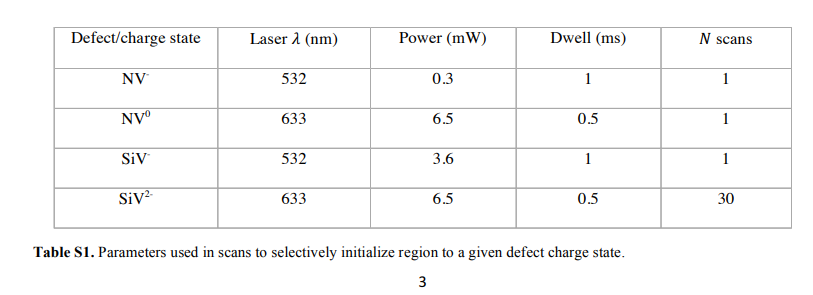
We initialize the NV and SiV charge states prior to parking the laser beam via a laser scan. In general, the processes at work in these scans can be complex, requiring careful selection of laser power, scanning speed and number of repeats to optimize the initialization fidelity. Some components of the dynamics at play can be singled out, such as the photoionization of NV centers to the neutral state, which is accomplished with good fidelity using only a single high-power red scan. Preparation of SiV in a well-defined charge state is more involved, however, since the scanning laser beam continuously generates charges that are captured by remote defects, while simultaneously undergoing direct photoexcitation under the illumination spot. For instance, SiV2- is rapidly generated under direct red illumination, while SiV- is formed from proximal capture of holes in the region immediately adjacent to the point of illumination. Consequently, SiV2- initialization is optimized when a high power (6.5 mW) red laser is rapidly scanned (i.e., a short dwell time per pixel) multiple times. Figures S3a and S3b show some characteristic SiV- response as a function of the number of red scans and red laser power.

Figure S3. Optimizing red and green initialization scans at room temperature. (a) For a fixed red power (6.5 mW) and dwelltime-per-pixel (0.5ms), background SiV- fluorescence (mean photon counts in a given image area) are reduced as the scan number increases; up to 30 scans are required to bleach a region of interest into SiV2-. (b) Power dependence of red bleaching scans for 10 scans and 0.5-ms dwell time. (c) SiV- and (d) NV--band fluorescence as a function of green laser power after 1 scan with a 1- ms dwell time. Note the significant reduction of NV- fluorescence, indicating population of NV0: some NV- fluorescence is also collected in the SiV- band, and competes with an increase in SiV- at higher powers, resulting in a smaller (7%) drop in mean counts.
Green laser power offers a rudimentary though effective handle on selecting which charge states are preferentially initialized in a green scan. In Figs. S3c and S3d we plot the SiV- and NV- fluorescence as a function of green laser power, showing that under higher laser powers, SiV- remains abundant, in agreement with Ref. [1]. The slight (7%) reduction of SiV- fluorescence in Fig. S3c is, we believe, mostly an artifact due to a reduction of the NV- fluorescence captured within the SiV- band, which can be significant; additional work, however, is in order. Table S1 concisely summarizes the optimal parameters required for generating a particular charge state using green or red laser scanning. Under our present conditions, the generation of SiV0 is not strongly affected by the charge state initialization history. Figures S4a and S4b show the SiV- pattern following a green park on SiV-- and SiV2--rich surfaces produced via green and red laser scans, respectively. In both cases, we find dark central disks similar in size, which indicate the formation of SiV0 remains largely unchanged. Given the greater abundance of substitutional nitrogen — and, thus, its dominant role on the charge dynamics of the system — this observation suggests that green and (repeated) red illumination have a comparable effect on N+, preferentially transforming it into the positive charge state. For completeness, we mention that similar observations in the NV--selective band show that the NV0 disk (still dark in this configuration of the microscope) matches the outer diameter of the SiV- ring in Fig. S4b, as would be expected for a single-hole capture process.


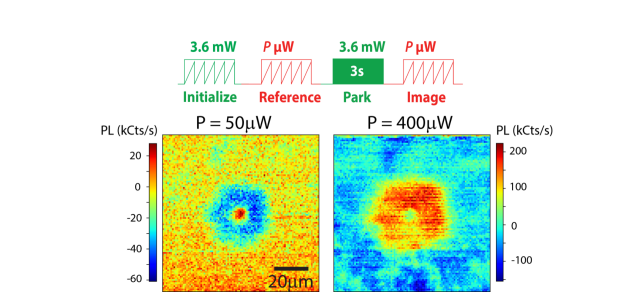
Figure S6. Red readout power dependence. Upper panel depicts protocol, green initialization scans generate an SiV--rich background, a subsequent 3.6-mW, 3-s green park generates a SiV0 halo. For weak red readout powers, the dark halo is clearly visible, whereas at stronger powers (400 µW here) the SiV0 is rapidly converted to bright SiV- during the scan and the dark halo vanishes. Each image is a composite, where a red readout image without a green park is subtracted from the image that follows the green park - the background of the 400 µW readout image appears significantly darker due to red bleaching of SiV and residual NV during the reference imaging step.
 闽ICP备2021005558号-1
Leave A Message